


From SAMHSA's list, November 16, 2026
How far is treatment from each Missouri county?
Our starting point was the center of each county; Missouri has 115 of them. From there we measured the miles to the closest medicine clinic, detox and live-in program. 1,423,033 people, in 70 counties, have no detox within 30 miles. 33 counties have zero treatment sites.
For you or a relative: keep the ZIP code and insurance card close by. Paid referral line; a partner, not any listed program, answers.
All 115 counties
Counties run in order of how far each is from its closest detox. Miles are counted in a straight line, so the real drive is longer.
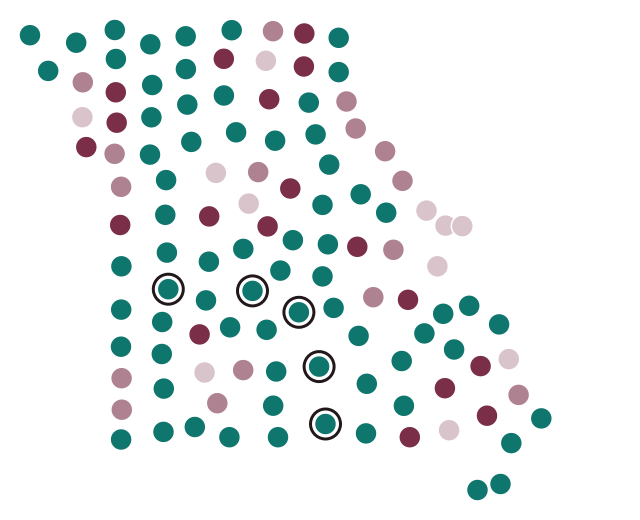
- up to 10 mi 11
- 10–20 mi 16
- 20–30 mi 18
- over 30 mi 70
- Farthest: Howell 74 mi, Texas 66 mi, Camden 62 mi, St. Clair 62 mi, Pulaski 62 mi
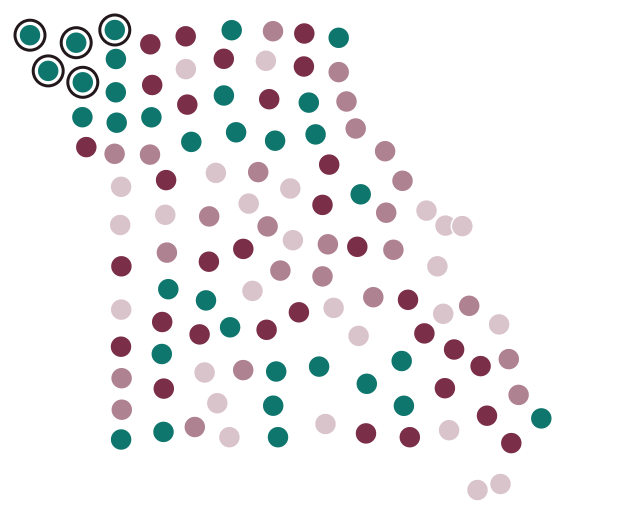
- up to 10 mi 26
- 10–20 mi 25
- 20–30 mi 31
- over 30 mi 33
- Farthest: Atchison 100 mi, Holt 77 mi, Nodaway 70 mi, Andrew 62 mi, Worth 51 mi
| County | Population 2024 | Listed facilities | Detox, mi | Residential, mi | MAT, mi |
|---|---|---|---|---|---|
| Howell County | 40,762 | 5 | 73.6 | 0.4 | 0.4 |
| Texas County | 25,715 | 1 | 65.8 | 32.5 | 2.6 |
| Camden County | 44,135 | 4 | 62.4 | 4.9 | 23.5 |
| St. Clair County | 9,848 | 0 | 62.4 | 34.2 | 33.2 |
| Pulaski County | 53,964 | 0 | 62.0 | 26.6 | 26.7 |
| Shannon County | 7,275 | 1 | 59.9 | 35.0 | 10.5 |
| Harrison County | 8,186 | 0 | 57.5 | 27.6 | 27.6 |
| Atchison County | 5,139 | 0 | 55.8 | 99.9 | 55.8 |
| Vernon County | 19,787 | 3 | 55.8 | 1.3 | 1.1 |
| Mercer County | 3,452 | 0 | 55.5 | 23.6 | 23.6 |
| Henry County | 22,575 | 3 | 55.4 | 18.0 | 27.1 |
| Livingston County | 14,658 | 2 | 55.4 | 21.1 | 2.0 |
| Miller County | 25,668 | 1 | 54.0 | 12.2 | 12.1 |
| Grundy County | 9,766 | 3 | 53.4 | 2.9 | 2.9 |
| Oregon County | 8,699 | 0 | 53.3 | 24.5 | 22.8 |
| Worth County | 1,872 | 0 | 51.9 | 51.2 | 51.2 |
| Reynolds County | 5,927 | 1 | 51.3 | 36.7 | 19.3 |
| Benton County | 20,614 | 1 | 51.2 | 20.4 | 28.6 |
| Pemiscot County | 14,407 | 3 | 51.0 | 3.8 | 15.6 |
| Ozark County | 9,090 | 0 | 50.6 | 32.7 | 23.3 |
| Hickory County | 8,766 | 0 | 49.2 | 35.6 | 24.2 |
| Bates County | 16,394 | 1 | 49.0 | 27.4 | 0.7 |
| Iron County | 9,420 | 0 | 47.0 | 20.2 | 20.2 |
| Laclede County | 36,738 | 1 | 46.8 | 28.7 | 4.7 |
| Cedar County | 15,023 | 1 | 46.7 | 29.2 | 21.7 |
| Clark County | 6,623 | 1 | 46.2 | 34.2 | 1.2 |
| Callaway County | 45,126 | 3 | 46.0 | 22.2 | 3.8 |
| Barry County | 35,618 | 6 | 45.9 | 36.3 | 27.1 |
| Daviess County | 8,541 | 0 | 45.6 | 21.2 | 21.2 |
| Madison County | 12,852 | 1 | 45.2 | 21.2 | 7.1 |
| Dunklin County | 27,002 | 3 | 44.9 | 4.9 | 4.9 |
| Dent County | 14,721 | 2 | 44.5 | 4.1 | 3.3 |
| Caldwell County | 9,000 | 0 | 44.4 | 35.4 | 25.0 |
| New Madrid County | 15,212 | 0 | 44.0 | 24.5 | 19.3 |
| Ste. Genevieve County | 18,546 | 1 | 42.3 | 14.3 | 14.3 |
| Osage County | 13,478 | 0 | 41.7 | 18.3 | 18.3 |
| Audrain County | 24,304 | 3 | 41.5 | 29.4 | 5.4 |
| Maries County | 8,506 | 0 | 41.0 | 17.5 | 25.4 |
| Phelps County | 45,672 | 3 | 40.7 | 6.3 | 20.5 |
| Cole County | 77,625 | 5 | 40.6 | 6.9 | 6.9 |
| Johnson County | 55,880 | 5 | 40.4 | 6.4 | 6.4 |
| Nodaway County | 20,503 | 1 | 39.8 | 70.4 | 39.8 |
| St. Francois County | 67,503 | 3 | 37.4 | 5.3 | 5.3 |
| Wright County | 19,505 | 1 | 37.4 | 37.4 | 14.9 |
| Morgan County | 22,399 | 0 | 37.2 | 23.9 | 16.8 |
| Douglas County | 12,290 | 1 | 36.9 | 36.4 | 8.0 |
| Linn County | 11,910 | 2 | 36.8 | 30.1 | 6.4 |
| Shelby County | 5,926 | 0 | 36.8 | 31.6 | 31.6 |
| Randolph County | 24,077 | 2 | 36.6 | 31.2 | 3.2 |
| Gentry County | 6,298 | 0 | 35.7 | 43.4 | 35.6 |
| Monroe County | 8,890 | 0 | 35.7 | 35.7 | 23.7 |
| Chariton County | 7,397 | 0 | 35.1 | 35.1 | 18.7 |
| Mississippi County | 11,750 | 2 | 35.0 | 34.7 | 6.9 |
| Dallas County | 17,877 | 0 | 34.7 | 32.5 | 20.1 |
| Lafayette County | 33,511 | 5 | 34.5 | 21.2 | 13.6 |
| Ray County | 23,199 | 1 | 34.3 | 19.5 | 2.3 |
| Dade County | 7,622 | 1 | 34.2 | 33.4 | 1.0 |
| Taney County | 56,744 | 4 | 34.2 | 7.8 | 7.8 |
| Warren County | 38,478 | 2 | 33.3 | 15.6 | 3.6 |
| Carroll County | 8,414 | 1 | 32.6 | 32.6 | 26.4 |
| Barton County | 11,717 | 1 | 32.3 | 24.9 | 3.5 |
| Stone County | 32,630 | 2 | 32.3 | 16.9 | 13.7 |
| Perry County | 19,100 | 3 | 32.2 | 8.9 | 3.4 |
| Lewis County | 9,852 | 0 | 31.9 | 14.9 | 14.9 |
| Montgomery County | 11,511 | 1 | 31.8 | 31.8 | 2.5 |
| Carter County | 5,359 | 1 | 31.6 | 31.7 | 5.4 |
| McDonald County | 24,054 | 0 | 31.5 | 31.5 | 16.8 |
| Putnam County | 4,539 | 0 | 31.2 | 31.2 | 31.2 |
| Lawrence County | 39,151 | 1 | 30.9 | 28.4 | 1.8 |
| Holt County | 4,241 | 0 | 30.8 | 77.2 | 30.8 |
| Sullivan County | 5,750 | 1 | 29.1 | 27.4 | 27.4 |
| Scotland County | 4,698 | 0 | 28.2 | 28.2 | 22.4 |
| Polk County | 33,070 | 2 | 27.7 | 27.7 | 1.6 |
| Stoddard County | 28,438 | 1 | 26.7 | 28.7 | 19.9 |
| Bollinger County | 10,610 | 2 | 25.9 | 26.1 | 2.8 |
| Gasconade County | 14,655 | 2 | 24.9 | 24.9 | 6.6 |
| Macon County | 15,177 | 2 | 24.9 | 24.9 | 24.9 |
| Boone County | 192,154 | 12 | 24.6 | 1.3 | 1.4 |
| Clinton County | 21,721 | 0 | 24.6 | 31.7 | 23.6 |
| Ripley County | 10,715 | 1 | 24.6 | 24.6 | 24.6 |
| Moniteau County | 15,294 | 0 | 24.2 | 19.2 | 19.7 |
| Wayne County | 10,820 | 4 | 23.7 | 26.5 | 1.1 |
| Cass County | 113,873 | 5 | 23.0 | 1.8 | 1.4 |
| Washington County | 23,583 | 1 | 22.9 | 22.9 | 6.8 |
| Pettis County | 43,791 | 2 | 22.3 | 18.4 | 2.2 |
| Platte County | 113,207 | 0 | 22.1 | 22.0 | 18.6 |
| DeKalb County | 9,884 | 1 | 22.0 | 44.6 | 21.3 |
| Knox County | 3,740 | 0 | 22.0 | 22.0 | 22.0 |
| Schuyler County | 4,069 | 0 | 19.4 | 19.4 | 19.4 |
| Crawford County | 22,808 | 1 | 17.7 | 17.7 | 2.2 |
| Webster County | 42,041 | 1 | 17.5 | 17.5 | 17.5 |
| Clay County | 263,370 | 5 | 17.3 | 12.8 | 4.9 |
| Scott County | 37,957 | 4 | 16.6 | 16.9 | 11.8 |
| Franklin County | 107,256 | 7 | 15.9 | 15.9 | 3.8 |
| Newton County | 61,519 | 8 | 15.0 | 15.0 | 3.1 |
| Jasper County | 126,479 | 4 | 14.8 | 13.8 | 2.4 |
| Marion County | 28,425 | 6 | 14.8 | 10.8 | 10.8 |
| Andrew County | 18,091 | 0 | 13.9 | 62.3 | 13.9 |
| Howard County | 10,150 | 0 | 13.7 | 13.7 | 13.7 |
| Ralls County | 10,499 | 1 | 12.5 | 12.5 | 11.0 |
| Christian County | 96,045 | 3 | 12.0 | 8.9 | 9.1 |
| Lincoln County | 65,888 | 2 | 11.8 | 11.8 | 5.3 |
| Pike County | 17,961 | 2 | 11.6 | 11.6 | 11.6 |
| Jackson County | 727,362 | 36 | 10.2 | 4.5 | 4.5 |
| Jefferson County | 231,888 | 8 | 10.0 | 9.1 | 8.1 |
| Cape Girardeau County | 83,658 | 5 | 9.8 | 10.5 | 9.1 |
| Buchanan County | 83,574 | 5 | 8.4 | 40.7 | 8.4 |
| Cooper County | 17,122 | 3 | 7.7 | 7.7 | 7.7 |
| St. Charles County | 423,726 | 14 | 7.4 | 3.7 | 5.6 |
| Saline County | 23,325 | 2 | 7.4 | 7.4 | 7.4 |
| St. Louis County | 992,929 | 21 | 7.0 | 0.1 | 2.3 |
| Greene County | 307,942 | 16 | 3.6 | 3.6 | 1.4 |
| Adair County | 25,660 | 2 | 2.4 | 2.4 | 2.4 |
| Butler County | 41,814 | 4 | 2.3 | 2.3 | 2.3 |
| St. Louis city | 279,695 | 16 | 0.9 | 0.8 | 0.8 |
Don't know where to begin?
Still working out which program suits you or your loved one? Any listed program can be contacted directly, and there is also the referral line below.
Paid referral line; a partner, not any listed program, answers.
Method
Facilities: all Missouri listings in SAMHSA FindTreatment.gov that report substance use treatment or detox, November 16, 2026 snapshot. County centers come from the Gazetteer that the U.S. Census Bureau put out in 2024. Population figures are Census estimates for 2024. We put each facility in a county according to its ZIP code (from the Census ZCTA-to-county file). Distance is the great-circle mileage from each county's internal point out to where the facility's listed coordinates put it; where SAMHSA gives no coordinates, the address is run through the Census Geocoder, and with no street published, the listing sits at its ZIP code center. Certified opioid treatment programs (OTP) fall under medication-assisted treatment (MAT) here. Anyone may reuse this data if they link to this page.